
Cap rate sensitivity shows how much a property's value, and your client's returns, move when the cap rate moves while income stays the same. Because value equals NOI divided by the cap rate, a 50 basis point shift on a 6.5% cap changes value by roughly 7% to 8%. The same shift can decide whether a deal clears a lender's DSCR and leverage tests. Brokers who run the grid before submission walk into lender calls with answers instead of surprises.
TL;DR
- Value is NOI divided by the cap rate, so a cap rate change moves value with no change in income. The effect is bigger when cap rates fall than when they rise by the same amount.
- Stress the exit cap at ±50, ±100 and ±150 basis points around your base case, and pair it with an NOI or rate shock.
- Run a DSCR check on each stress case. In the example below, a 200 basis point rate shock and a 10% NOI decline take a healthy 1.32x to 0.98x.
- Treat an exit cap at or below the going-in cap as an assumption that needs a reason, not a default.
- Put the grid in the submission so the lender sees you already tested the weak points.
Table of Contents
- What cap rate sensitivity actually measures
- A worked example: $500,000 of NOI across the cap rate range
- Why the exit cap rate moves returns so much
- How to build the grid
- DSCR stress testing, with real numbers
- Reading the results: what to do with a stressed case
- What is a safe cap rate?
- Common mistakes that skew the grid
- Our perspective on stress testing as a broker
- Put the grid into your next submission
- FAQ
- Sources
What cap rate sensitivity actually measures
The cap rate is net operating income divided by value. Rearranged, value is NOI divided by the cap rate. A sensitivity analysis holds NOI fixed, flexes the cap rate across a band, and records what happens to value, loan proceeds, equity and returns.
The question it answers is simple: how wrong can the cap rate assumption be before the deal stops working? That matters most for the exit cap rate, the rate used to price the property at sale or refinance. Sale proceeds make up most of the total return on a typical multi-year hold, so a small error there outweighs a lot of rent growth.
The OCC's guidance for examiners makes the same point from the lending side. Its Comptroller's Handbook on commercial real estate lending describes sound CRE policies as including minimum DSCR standards, LTV limits by property type, minimum debt yield and an evaluation of how projections hold up when variables such as interest rates, vacancy and operating expenses change. Lenders are already running some version of this test, so your package should show it first.
A worked example: $500,000 of NOI across the cap rate range
Take a stabilized property producing $500,000 of NOI. Hold that number fixed and change only the cap rate.
| Cap rate | Implied value | Change from 6.5% base |
|---|---|---|
| 5.5% | $9,090,909 | +18.2% |
| 6.0% | $8,333,333 | +8.3% |
| 6.5% | $7,692,308 | Base |
| 7.0% | $7,142,857 | -7.1% |
| 7.5% | $6,666,667 | -13.3% |
| 8.0% | $6,250,000 | -18.8% |
Three things stand out.
- Income did not change. The whole swing between $9.09 million and $6.25 million comes from the cap rate alone.
- The steps are uneven. Moving from 6.5% to 6.0% adds about 8.3% of value, while moving from 6.5% to 7.0% removes about 7.1%. Each downward tick adds more value than the last, which is why assuming cap rate compression flatters a model so much.
- One band matters more than the midpoint. A buyer who underwrote to 6.0% and meets a 7.0% market has lost about 14% of the value the model promised, before any change in operations.
This nonlinearity is the reason a single-point exit cap is a weak assumption. Table it across a band, then underwrite the deal to the conservative end.
Why the exit cap rate moves returns so much
In a hold-period model, the sale price is usually the single largest cash flow. Everything else, including annual cash flow and rent growth, adds up to less than the reversion. So when the exit cap is off, equity returns are off by more than the value change itself, because leverage magnifies the move.
A published example shows the scale. In a Bonfire Capital illustration, a $20 million property with $1.05 million of NOI loses about $2 million of sale price when the exit cap moves 50 basis points, from 5.25% to 5.75%. That is enough to turn a strong projected IRR into a weak one. Your own numbers will differ, but the pattern holds: small cap rate moves, big equity moves.

What drives cap rates in the first place
Cap rates do not move in isolation. Interest rates are one input. An academic study by Hess and Macha on interest rate elasticity of capitalization rates cites earlier work on U.S. apartments finding that a 100 basis point rise in interest rates went with roughly a 40 basis point rise in cap rates. That is a historical average, not a rule for any one deal, but it gives you a sensible way to link a rate scenario to a cap rate scenario. If your downside case has rates up 200 basis points, a cap rate wider by about 80 basis points is a reasonable starting point to test, and you can test more.
Financing conditions matter too. Matthews notes that in the current market, debt can cost as much as the cap rate or more, which leaves thinner cash flow margins and puts more weight on conservative exit pricing. When the cost of debt sits near the cap rate, leverage stops adding return and the sensitivity grid becomes more important.
How to build the grid
The classic sensitivity table is a two-variable grid. One axis is the exit cap rate, the other is a second driver, and each cell shows an output such as value, IRR, equity multiple or DSCR. A common building block is a matrix of NOI against price, as shown in this cap rate primer from Wall Street Prep, where higher NOI and lower price produce a higher cap rate.
Here is a practical sequence for a broker packaging a deal.
- Set the base case from evidence. Use trailing twelve month income and in-place rents, not pro forma figures. If you need to verify rents and leases first, a one-hour rent roll analysis is a quick way to get to a defensible NOI.
- Choose the going-in and exit cap. A conservative convention is to set the exit cap above the entry cap. Many underwriters use 25 to 75 basis points of expansion. If your model assumes compression, write down the specific thesis for it.
- Flex the exit cap in steps. Use ±50, ±100 and ±150 basis points around the base case.
- Choose the second variable. Rent growth, vacancy, expense growth or the loan rate. Pick the one most likely to be questioned for this asset type.
- Add the DSCR check to every cell or scenario. Returns alone do not tell you whether the loan survives.
- Read the break-even. Find the cap rate, NOI level or rate at which the deal fails the lender's test or the investor's minimum return.
For ranges on other inputs, one institutional framework from MMC Invest suggests roughly ±10% for stable inputs such as property tax and reserves, ±20% for cyclically sensitive inputs such as occupancy, and 50 to 100 basis point moves for interest rates. Use those as starting ranges and adjust them for the asset class and market.
DSCR stress testing, with real numbers
Cap rate sensitivity tells you about value. DSCR stress testing tells you about survival. They connect through the loan: value drives proceeds at a given LTV, and the rate drives the payment.
Take the $500,000 NOI property at the 6.5% base value of about $7.69 million. Assume a $5 million loan, about 65% LTV, with 30-year amortization. The debt yield is 10% (NOI divided by loan amount). Annual debt service at a 6.5% rate is about $379,000.
| Scenario | NOI | Rate | Annual debt service | DSCR |
|---|---|---|---|---|
| Base | $500,000 | 6.5% | about $379,000 | 1.32x |
| NOI down 10% | $450,000 | 6.5% | about $379,000 | 1.19x |
| Rate up 200 bps | $500,000 | 8.5% | about $461,000 | 1.08x |
| Both together | $450,000 | 8.5% | about $461,000 | 0.98x |
These figures are illustrative calculations, not market quotes. They show why a deal that looks comfortable at 1.32x can fail under a combined shock. Neither stress alone is extreme, yet together they push coverage below break-even.
What DSCR levels mean in practice
Lender minimums vary by loan type and lender. Bridge and transitional loans often set a minimum coverage trigger in a narrow band; one bridge loan stress testing guide describes triggers commonly around 1.20x, with some as low as 1.10x for transitional assets and as high as 1.25x for stabilized ones. Treat any stress case that falls below your target lender's minimum as a problem to fix before submission, not after.
If you want a deeper look at how lenders define the numerator, read our piece on DSCR versus NOI and how it causes 1.25 rejections. For the loan side, the DSCR loan guide for brokers covers how these loans are structured and placed.
Debt yield as a cross-check
Debt yield does not depend on the cap rate or the interest rate, so it holds steady when values and rates move. In the example, a 10% debt yield stays 10% in every scenario above. A lender who sees a value haircut can still size to debt yield, which is why it helps to know both measures before you choose lenders. Our broker playbook on debt yield versus LTV submissions walks through when each metric drives the sizing.
Reading the results: what to do with a stressed case
A grid is only useful if it changes a decision. Here is how to read it.
- Find the cliff. Look for the first scenario where DSCR drops under the lender's minimum, or where equity is wiped out. The distance between the base case and that cliff is your margin of safety.
- Check the refinance gap. If the exit or takeout depends on a cap rate or rate that may not exist, estimate the equity needed to pay off the loan under the stressed value. That gap is the real risk in a bridge-to-perm deal; see our note on stabilization before a six-month takeout.
- Name the fix. Lower leverage, a longer interest-only period, a rate cap, a reserve, a lender with a different sizing basis, or a layer of capital such as preferred equity or mezzanine debt may close the gap.
- Decide go or no-go early. If no reasonable fix survives the stressed case, better to know before you spend lender goodwill. A set of go/no-go criteria for screening CRE loan deals helps you make that call consistently.
What is a safe cap rate?
There is no universal safe cap rate. A cap rate reflects asset class, market, tenant quality, lease structure, condition and the return a buyer requires. A multifamily property in a supply-constrained market can trade at a much lower cap than a hotel or older office building, and both can be fairly priced.
The better question is whether the cap rate in your model is supported. A cap rate well above what comparable assets trade at is a prompt to ask why: vacancy, short leases, deferred maintenance or overstated income. A cap rate below recent trades needs a specific reason. The safest assumption is one that reflects transactions you can point to today, applied to income you can verify, with a conservative band around it.
Common mistakes that skew the grid
- Using pro forma NOI in the denominator. A cap rate on projected income is not comparable to market cap rates on actual income.
- Stressing one variable at a time. Real downturns hit rates, vacancy and cap rates together. Include combined cases.
- Checking DSCR only in year one. Check every year of the hold, since resets, amortization starts and rolling leases change coverage.
- Setting the exit cap equal to the entry cap by habit. Add expansion for age and hold length unless you can argue otherwise.
- Leaving the grid out of the submission. A lender who finds the weak point alone will often assume you did not see it.
Our perspective on stress testing as a broker
Most brokers we talk with know the formula. What slows them down is the time between a first call and a package a lender will take seriously. Sensitivity work usually gets squeezed out because sourcing lenders eats the day.
We built BrokersConnect to change that balance. When lender matching on property type, loan amount, location, leverage and credit profile happens in minutes against a database of 289+ verified lenders, you have time left to run the stress cases properly, attach them to the submission and set expectations with your borrower before a lender raises the issue.
Our view is that the broker who shows a tested downside case, and already knows which lenders size to debt yield and which to LTV, closes more of the deals worth closing. Everything in one place, from deal templates to the pipeline and AI-assisted packaging, is meant to make that discipline routine rather than heroic.
Theron
Put the grid into your next submission
BrokersConnect is a single platform for matching a deal to lenders, packaging it, and tracking the conversations that follow. You can run lender matching on your scenario, use deal templates and AI tools for packaging and underwriting support, send batch outreach, and keep every deal in a pipeline with a secure document vault. Pricing is a flat $50 per month with no commissions or transaction fees, and there is a free trial period.
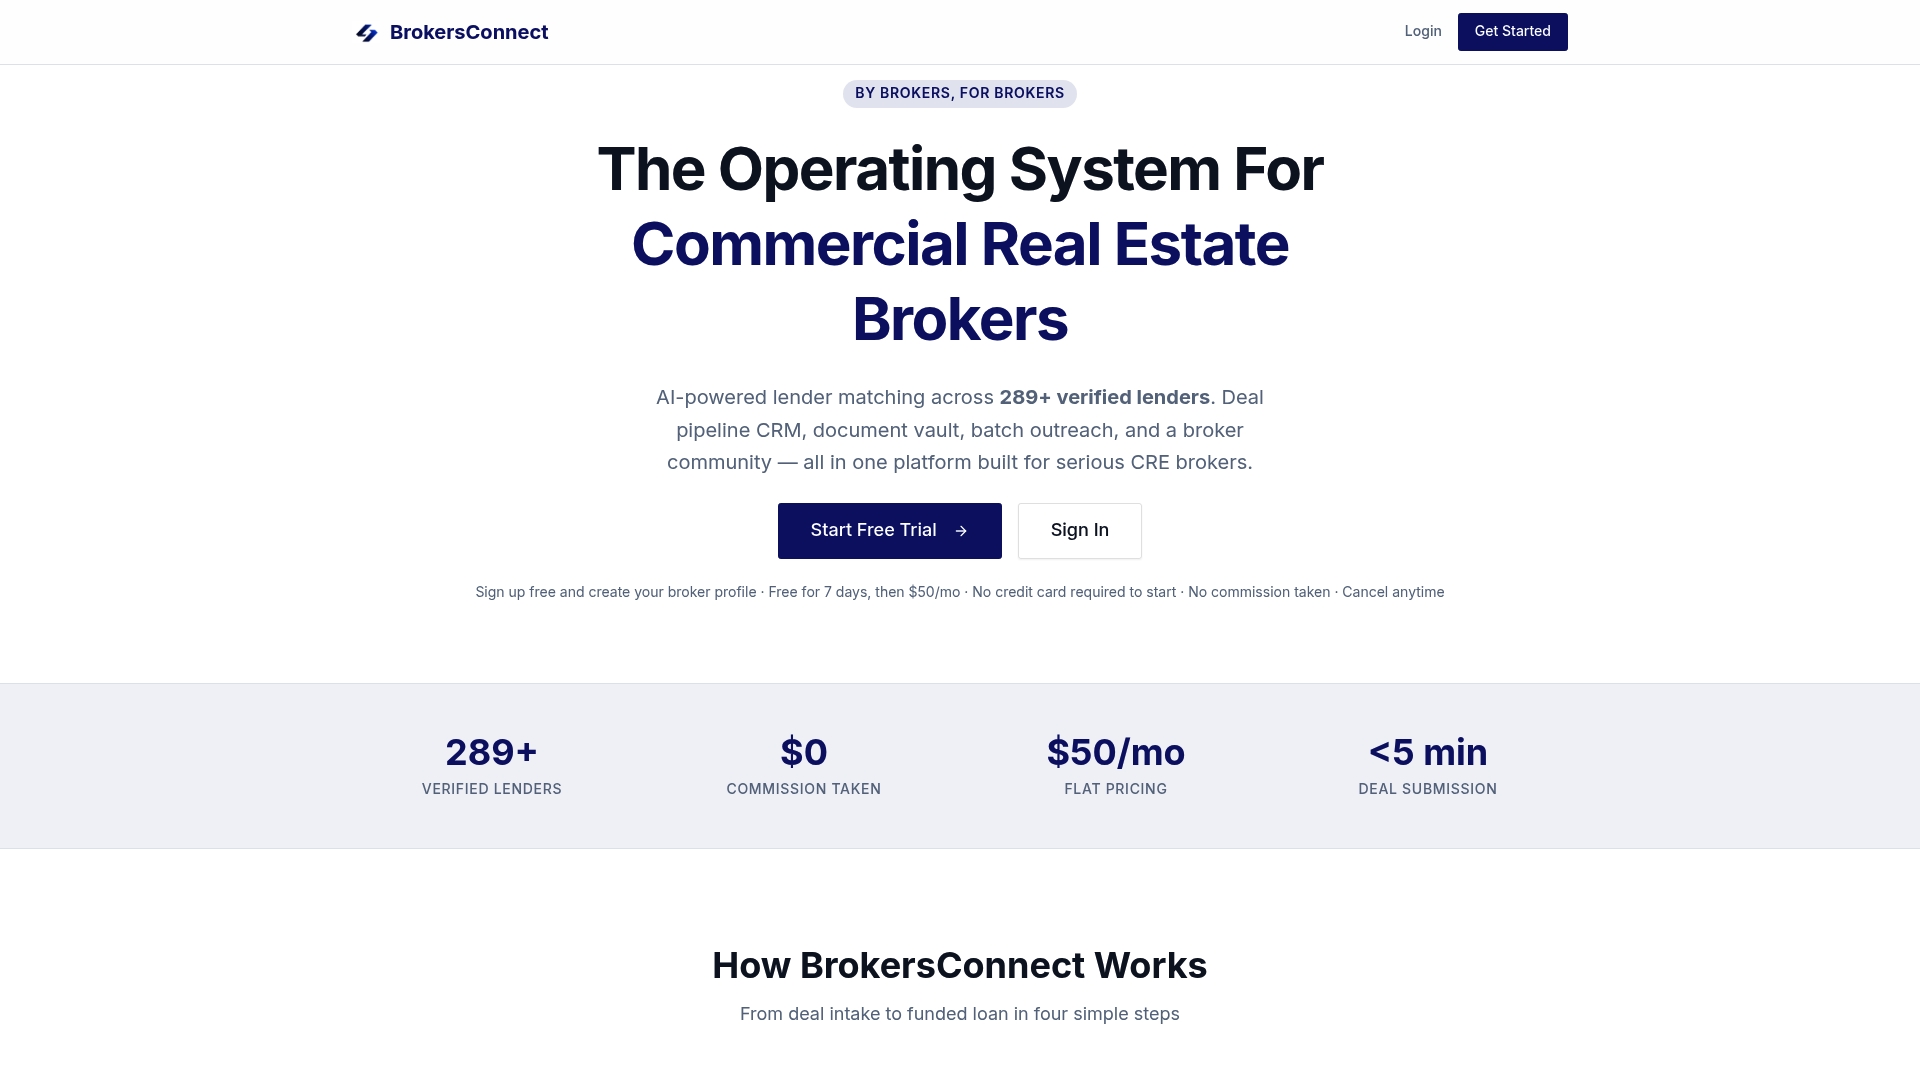
Start with the deal in front of you: try BrokersConnect and see which lenders fit its property type, size and leverage. If it is a DSCR loan, our first DSCR submission checklist shows what to have ready.
FAQ
What is cap rate sensitivity analysis?
It is a test of how value and returns change when the cap rate changes and income stays fixed. You flex the cap rate, usually the exit cap, across a band such as ±50, ±100 and ±150 basis points and record the effect on value, loan proceeds, IRR and DSCR. It shows how much room a deal has before it breaks.
How much does a 50 basis point cap rate change affect value?
It depends on the starting rate. On a 6.5% cap, moving to 7.0% lowers value by about 7.1%, while moving to 6.0% raises it by about 8.3%. The lower the cap rate, the larger the effect of each 50 basis points.
What does DSCR stress testing involve?
You recalculate debt service coverage under adverse assumptions, typically a higher interest rate, lower NOI, and both together. Then you compare each result with the lender's minimum and note which scenarios fall below it. Check every year of the hold, not only the first.
Is a 5.3% cap rate good?
It can be, depending on asset class, market and tenant strength. A stabilized, high-demand asset can trade at that level, while a property with volatile income cannot justify it. Judge it against recent comparable transactions and verified trailing income.
Sources
- Comptroller's Handbook: Commercial Real Estate Lending (OCC)
- Interest Rate Elasticity of Capitalization Rates (Hess and Macha)
- Understanding Cap Rates and Why Sensitivity Analysis Is Critical (Bonfire Capital)
- Cap Rates Explained: What Investors Need to Know (Matthews)
- Cap Rate Primer (Wall Street Prep)
- DSCR Under Stress: A Three-Method Underwriting Framework (MMC Invest)
- Interest Rate Cap Stress Testing (Waldev)