
The right compensation model is the one that maximizes your net income after every fee while matching the level of support you actually need. That means comparing fixed splits, tiered/capped splits, flat-fee or 100% plans, salary-plus-bonus arrangements, and revenue share, profit share, and equity grants against your real production numbers. Below, you'll find worked examples and a checklist to run that comparison yourself.
TL;DR:
- Flat-fee and 100% commission plans become advantageous only once an agent's deal volume makes fixed costs, like desk or technology fees, negligible relative to commissions earned.
- Tiered and capped split models require careful tracking of thresholds, resets, and fees, often best managed with automated tools to avoid errors and maximize earnings.
- Non-transaction income such as revenue share, profit share, and equity adds complexity and should be audited carefully, with emphasis on payout timing and vesting schedules.
- Local market conditions and deal volume heavily influence the most suitable compensation structure, with high-price markets favoring caps and lower-price, high-volume markets sticking to fixed splits.
Table of Contents
- Broker Compensation Models at a Glance
- Fixed Splits: The Traditional Model, Broken Down in Dollars
- Tiered and Capped Splits: Where the Real Money Math Happens
- Flat Fees and 100% Plans: When Fixed Costs Beat Percentages
- Salary-Plus-Bonus and Other Alternative Models
- Revenue Share, Profit Share, and Equity: The Income Layer Most Agents Ignore
- The Fees Most Agents Forget to Subtract
- How to Choose: A Decision Checklist and Modeling Worksheet
- BrokersConnect Resources: Templates That Turn Math Into a Signed Agreement
- Impact of Compensation Models on Agent Motivation and Performance
- Legal and Regulatory Considerations Affecting Broker Compensation Models
- Trends and Future Developments in Broker Compensation Models
- Comparison of Broker Compensation Models Across Different Regions or Markets
- What Agents Get Wrong When They Switch Compensation Plans
- An Easier Way to Run the Numbers on Every Offer
- Sources
Broker Compensation Models at a Glance
Most brokerage pay plans fall into a handful of families, and once you can name them, comparing offers gets a lot easier. The three main structures that dominate the industry are fixed splits, tiered (graduated) splits, and flat fees, but two more categories matter just as much for anyone weighing a career move: salary-based pay and non-transaction income like revenue share, profit share, or equity.
Here's the quick map, with who each model tends to suit:
- Fixed split: A constant percentage division (like 70/30) on every deal, regardless of volume. Fits new agents who want predictable, simple math and don't yet produce enough to benefit from a cap.
- Tiered/graduated split: Your split improves as you close more deals in a calendar year, often stepping from something like 60/40 up to 90/10. Fits mid-level producers who close consistently but not enough to blow past a cap in month three.
- Capped split: A fixed or tiered split that becomes 100% commission once you've paid a set dollar amount to the brokerage for the year. Fits high producers who can hit the cap early and then keep almost everything after.
- Flat fee / 100% plans: You pay a monthly desk fee or per-transaction fee instead of a percentage, keeping the rest of the commission. Fits experienced agents with steady volume and low need for in-house support.
- Salary plus bonus: A guaranteed base with performance bonuses layered on top, common at institutional brokerages, some new-construction builders, and salaried in-house teams. Fits agents who want income stability over unlimited upside.
- Revenue share / profit share / equity: Non-transaction income tied to recruiting, brokerage profitability, or company ownership. Layers on top of any of the above rather than replacing them.
You'll see fixed splits most often at traditional franchise brokerages, tiered and capped models at growth-focused independents, flat-fee plans at discount and cloud-based brokerages, and revenue share or equity at brokerages built around agent recruiting networks. Each gets its own breakdown below, with the math that actually determines what lands in your account.
Fixed Splits: The Traditional Model, Broken Down in Dollars
A fixed split means you and your brokerage divide every commission check at the same percentage, deal after deal, with no change based on volume. Ranges run wide, typically from 50/50 at full-service, high-support brokerages up to 90/10 at leaner shops, and the brokerage's cut usually funds office space, E&O insurance, compliance review, marketing platforms, lead generation, and administrative staff.
Here's what that split actually funds, in rough order of what agents care about most:
- Errors and omissions insurance and legal compliance review
- Brokerage-provided leads or referral pipelines
- Office space, signage, and branded marketing materials
- Transaction coordination and administrative support
- Training, mentorship, and technology stacks (CRM, e-signature, listing syndication)
Run the math on a realistic deal. Say you close a home at $400,000 with a 6% total commission, split evenly between the listing and buyer side, a common structure according to Investopedia's breakdown of brokerage fees. Your side nets $12,000 in gross commission income (GCI). At a 70/30 split, you keep $8,400 before any other fees. At 80/20, you keep $9,600. That 10-point difference in split percentage is worth $1,200 on this single deal, and it compounds fast across a full year of closings.
Quick math: On a $12,000 GCI deal, moving from a 70/30 split to an 80/20 split puts an extra $1,200 in your pocket, before transaction fees or franchise pass-throughs are even factored in.
The catch is that headline percentages rarely tell the whole story. Many agents lock in on the split number and miss that recurring fees and services they'd otherwise pay for out of pocket can flip which brokerage actually pays more per year.
Tiered and Capped Splits: Where the Real Money Math Happens
Tiered splits improve your percentage as your production climbs within a calendar year, and capped splits go a step further by letting you keep 100% of commission once you've paid the brokerage a set dollar amount. Understanding how these two mechanics interact matters more than memorizing any single split percentage, because the cap is usually where the real financial difference shows up.
Tiers work one of two ways. A progressive tier applies the improved split only to commissions earned after you cross a threshold, similar to how income tax brackets work. A retroactive tier bumps your entire year's earnings to the new percentage once you cross the line, which is far more lucrative but rarer to find. Caps reset annually, typically on your anniversary date or the calendar year, and once you hit the cap, you're commonly billed only per-transaction or monthly fees for the remainder of the period.
Cap ranges to know: Common cap thresholds on popular cap-based brokerage models run roughly $12,000 to $35,000 annually, meaning that's the total dollar amount you pay the brokerage before flipping to keep-it-all status for the rest of the year.
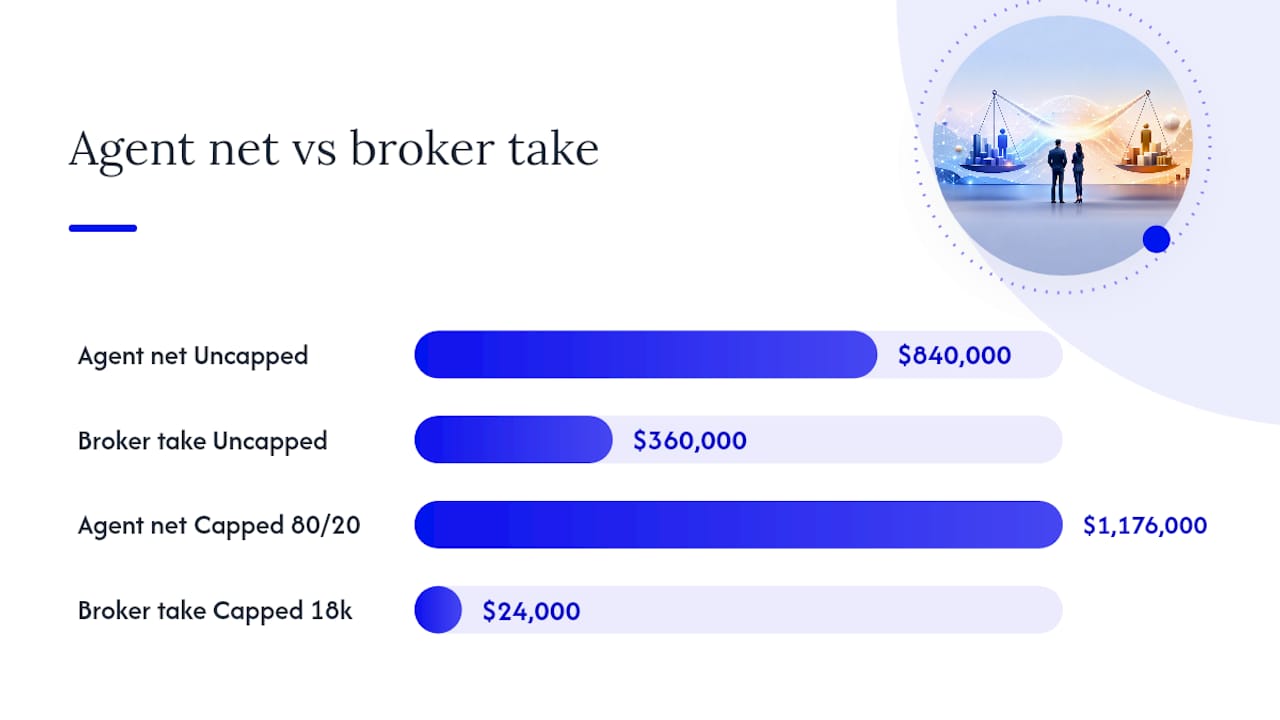
Consider two agents with identical production, both closing $1,200,000 in GCI over a year, at brokerages with different structures:
- Uncapped 70/30 split: The agent keeps $840,000 all year, with no change regardless of volume.
- Capped plan with an $18,000 cap on an 80/20 split: The agent pays 20% of GCI up to $18,000, which they hit after $90,000 in GCI (roughly one strong quarter for a full-time producer). After that, they keep 100% of the remaining $1,110,000 in GCI, minus smaller per-transaction fees.
The uncapped agent nets $840,000. The capped agent, after paying the $18,000 cap and maybe another $6,000 in transaction fees across 40 closings, nets closer to $1,176,000. That's a difference of over $300,000 on identical production, and it's why capped plans overwhelmingly favor mid-to-high producers who can clear the cap early in the year. A newer agent who closes $150,000 in GCI annually would barely benefit from the same cap and might do better on a lower fixed split with no cap complexity at all.
The administrative complexity is real, too. Tracking tier thresholds, cap resets, and retroactive versus progressive math by hand invites errors, which is exactly why more brokerages and teams now lean on fee calculators and automated tracking instead of spreadsheets rebuilt every January.
Flat Fees and 100% Plans: When Fixed Costs Beat Percentages
Flat-fee and 100% commission plans flip the entire model: instead of paying a percentage of every deal, you pay the brokerage a fixed monthly desk fee, a flat per-transaction fee, or both, and keep the rest.
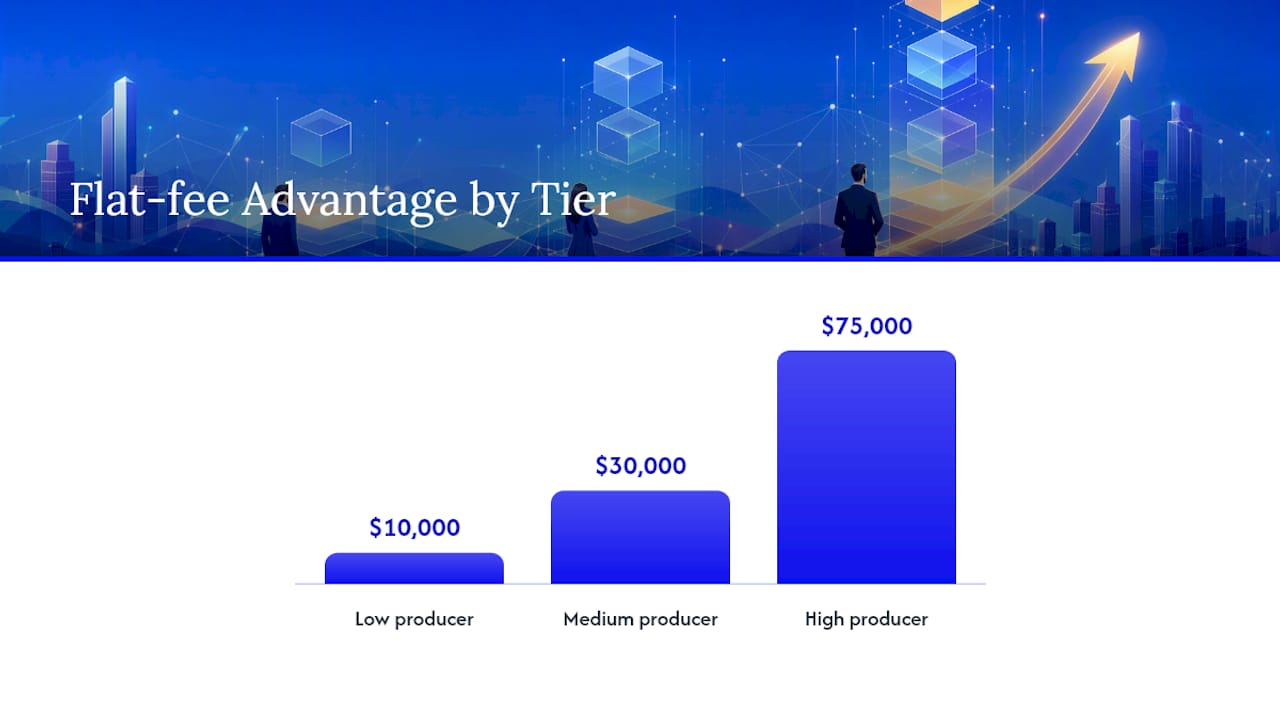
The math only favors this model past a certain production level. Compare a flat $500-per-transaction model against a traditional 70/30 split, across three production tiers:
- Low producer (4 closings/year, $10,000 average GCI per deal): On a 70/30 split, they keep $28,000. On the $500 flat-fee model, they keep $38,000. The flat fee wins, but only because volume is low enough that the fixed cost stays trivial relative to each deal.
- Medium producer (12 closings/year, $10,000 average GCI per deal): The 70/30 split nets $84,000. The flat-fee model nets $114,000. The gap widens sharply as deal count climbs, because the flat fee doesn't scale with commission size.
- High producer (30 closings/year, $10,000 average GCI per deal): The split nets $210,000. The flat-fee model nets $285,000, assuming no monthly desk fee on top. At this volume, the difference is enormous, which is exactly why experienced, high-closing agents gravitate toward 100% plans.
The trade-off is what the flat fee doesn't include. Common add-ons stacked on top of the base per-transaction charge are:
- Monthly desk or technology fees, often $100 to $500
- Franchise fee pass-throughs on top of the desk fee, common at branded 100% shops
- Errors and omissions insurance charged separately per transaction
- Transaction coordination fees if you want hands-off paperwork support
Those fixed costs are the real risk in a slow month. A brokerage's own guide to broker earnings and net pay points out that 100% plans can quietly cost more than a percentage split when production dips, because you're paying the same desk fee whether you closed five deals or zero. Percentage splits scale down with you; flat fees don't.
Salary-Plus-Bonus and Other Alternative Models
Not every agent wants pure commission risk, and salary-plus-bonus plans exist for exactly that reason. Under this model, you receive a guaranteed base salary, sometimes structured as a draw against future commissions, plus a bonus tied to closings, customer satisfaction scores, or team performance.
The trade-off is straightforward: you give up unlimited upside in exchange for income stability. A top producer on a fixed split might clear $300,000 in a strong year; a salaried agent doing similar volume might cap out around $90,000 to $120,000 in base plus bonus, but that number holds steady even in a slow quarter.
Where you'll actually find this structure:
- New-home sales teams working for homebuilders, where reps are often salaried plus per-sale bonuses
- Institutional and relocation brokerages that value consistency and standardized service over individual entrepreneurial upside
- Team leader support roles where a lead agent puts junior agents or showing assistants on payroll rather than a straight split
- iBuyer and tech-enabled brokerage models, some of which salary their agents to control service quality at scale
If you're risk-averse, transitioning careers, or building a family budget around predictable income, this model deserves a serious look even though it rarely shows up in traditional recruiting pitches.
Revenue Share, Profit Share, and Equity: The Income Layer Most Agents Ignore
Non-transaction compensation doesn't replace your commission split, it stacks on top of it, and it's often the piece agents forget to model when comparing brokerage offers.
Revenue share typically rewards you for recruiting other productive agents into the brokerage, paying you a percentage of the commissions those recruits generate, for as long as they stay active. Profit share works differently: it's calculated against the brokerage's net income rather than gross commissions, meaning payouts depend on company-wide profitability, not just recruiting volume. Equity grants go further still, offering actual ownership stakes, usually vesting over several years, common at venture-backed and cloud brokerages trying to retain top producers long term.
Here's what to check before you factor any of these into your decision:
- Ask whether revenue share is capped per recruit or unlimited
- Confirm whether profit share is paid annually, quarterly, or tied to a liquidity event
- Get the vesting schedule in writing for any equity grant, including what happens if you leave early
- Ask for the company's last two years of profit-share payout history, not just the plan's theoretical structure
Pro Tip: Equity grants are real value, but they're illiquid and hard to price. Model equity conservatively at a fraction of the brokerage's stated valuation, and never let a stock grant talk you into accepting a worse commission split today.
The Fees Most Agents Forget to Subtract
Every compensation comparison falls apart if you only look at the headline split or fee number and skip the smaller charges layered underneath it. These are the ones that quietly eat into net pay:
- Transaction fees: Flat charges per closing, commonly $250 to $600, sometimes on top of a percentage split rather than instead of one
- Franchise fee pass-throughs: A percentage the local office pays up to a national brand, sometimes passed directly to agents, especially common at branded 100% plans
- Marketing chargebacks: Costs for brokerage-provided marketing materials or lead platforms deducted from your check even if you didn't request them
- E&O insurance fees: Often billed per transaction, typically in the $20 to $75 range
- Compliance or file review fees: Charged whether the file review takes five minutes or five hours
By the numbers: Desk fees and franchise pass-throughs vary widely across brokerages, and on capped plans specifically, they're frequently the deciding factor in whether a "generous" cap actually beats a lower, simpler split.
Payout timing matters just as much as the fee amounts. Most brokerages hold commission checks until the transaction fully closes and funds, and some add an internal processing delay of a few business days to a week beyond that. If you're comparing offers, ask directly who cuts the buyer broker's check, how fast funds clear after closing, and whether the brokerage places any commission on hold pending file audit. A sample fee agreement with clear payout language protects you here more than a verbal promise ever will.
How to Choose: A Decision Checklist and Modeling Worksheet
Comparing compensation plans on gut feeling is how agents end up locked into a worse deal for a full year. Running the numbers takes maybe twenty minutes per offer, and it's the only way to know which model actually wins for your specific production level.
Start with these four questions before you look at a single split percentage:
- What's your realistic annual closing count and average GCI per deal? Be honest, not aspirational. Use last year's actual numbers if you have them.
- How much brokerage support do you need? New agents leaning on training, leads, and mentorship should weight that support heavily, even if it costs a lower split.
- How sensitive are you to cash flow swings? A flat-fee plan with high fixed costs can hurt badly in a slow month, even if it wins on paper across a full year.
- Does the brokerage offer non-transaction income you'd actually use? Revenue share is worthless to you if you have no interest in recruiting.
From there, build a simple worksheet with these fields for every offer you're comparing:
- Projected annual GCI (deals × average commission per deal)
- Split percentage or flat-fee structure, applied to that GCI
- Cap amount and dollar point at which you'd hit it, if applicable
- Recurring fixed fees (monthly desk fee, franchise pass-through, technology fee)
- Per-transaction fees (E&O, compliance, transaction coordination)
- Any projected revenue share, profit share, or equity value, modeled conservatively
- Net income after every line above, for low, average, and high production scenarios
That last step matters more than any other. Modeling at least three production scenarios, low, average, and high, over a two-year window rather than a single year, exposes which plans are resilient and which only look good under best-case assumptions.
Here's how that plays out for two different agents evaluating the same two offers, a straight 70/30 uncapped split versus a capped 80/20 plan with an $18,000 cap:
Low producer, closing $200,000 in GCI annually: The 70/30 split nets $140,000. Close, but the capped plan edges ahead even at modest volume, because $18,000 isn't an unreasonable amount to pay against $200,000 in production.
High producer, closing $900,000 in GCI annually: The 70/30 split nets $630,000. The capped plan nets roughly $864,000 after the cap and fees, a gap of well over $200,000. At this volume, the cap pays for itself in the first two months and everything after is nearly pure upside.
The lesson holds across almost every comparison: the further above the cap threshold you produce, the more a capped model wins, and the closer to it you sit, the more fixed fees and cap size matter more than the headline split percentage ever will.
Pro Tip: Ask every brokerage for their decision on exclusivity versus open listings as part of your comparison, too. Listing structure affects how many of your deals actually generate full commission versus a referral split, which changes your real GCI more than most agents realize.
BrokersConnect Resources: Templates That Turn Math Into a Signed Agreement
Once you've picked a model, you need the paperwork and the ongoing tracking to match it, and that's where most agents get stuck translating a spreadsheet decision into an actual signed agreement.
BrokersConnect's sample broker fee agreement walks through the clauses that actually govern payout, including:
- Split percentage or flat-fee language, written to match exactly what was verbally negotiated
- Cap amount, reset date, and what happens to the split immediately after the cap is hit
- Payout timing and any commission-hold conditions tied to file review or audit
- Fee stacking language, so transaction fees and franchise pass-throughs are spelled out rather than assumed
Pairing that template with a documented fee calculation workflow removes the guesswork from tracking where you stand against a cap or tier threshold mid-year. Instead of rebuilding a spreadsheet every time your split changes, you get a repeatable process for running the same net-income math covered above, whether you're evaluating a new offer or auditing your current one.
Impact of Compensation Models on Agent Motivation and Performance
Compensation structure shapes behavior more directly than most brokers admit out loud. Uncapped, high-split models tend to attract agents motivated by pure production, agents who close deals fast and don't need much hand-holding, because every additional closing pays out at nearly the same rate as the last. Tiered and capped models create a different psychology entirely: agents often push harder in the final months before their cap resets, since production right before a reset locks in a higher effective split for the rest of the period.
Salary-plus-bonus models produce steadier, more consistent effort, but usually cap the ceiling on individual drive, since the marginal dollar from an extra closing matters less to someone with a guaranteed base. Revenue share adds a layer that shifts some agents' focus from personal production toward recruiting, which can be a strength for brokerage growth but a real distraction from an individual agent's own closing volume if not balanced carefully.
None of these effects are universal. A disciplined agent performs well under almost any structure. But brokerages that mismatch their compensation model to their agent pool, offering a pure-production split to agents who need steady income, or a salaried model to agents who thrive on unlimited upside, tend to see higher turnover regardless of how competitive the numbers look on paper.
Legal and Regulatory Considerations Affecting Broker Compensation Models
Commission structures don't exist in a legal vacuum, and a few regulatory realities shape what brokerages can and can't do with compensation.
Real Estate Settlement Procedures Act (RESPA) rules govern referral fees and prohibit kickbacks tied to settlement services, which matters directly for any agent receiving revenue share, referral income, or fees tied to recommending a lender, title company, or other settlement provider. Structuring referral or revenue-share arrangements without clear RESPA-compliant clauses can expose both the agent and the brokerage to real penalties, not just a compliance headache.
Independent contractor classification is another live issue. Most commission-based agents are classified as independent contractors rather than employees, which affects tax withholding, benefits eligibility, and how much control a brokerage can exert over an agent's schedule and methods without risking misclassification. Salary-plus-bonus models complicate this further, since guaranteed pay and closer supervision can push an agent's classification closer to employee status under some state labor tests.
Every compensation agreement should also be a written contract, not a verbal understanding. Split percentages, cap terms, and fee stacking need to be documented clearly enough that a dispute over a specific commission check has something concrete to point back to.
Trends and Future Developments in Broker Compensation Models
The clearest trend in brokerage pay right now is the steady shift toward capped and flat-fee models, pulling market share away from traditional uncapped splits, especially among mid-to-high producers who've done the net-income math and realized how much a cap can save them annually. Cloud-based and virtual brokerages, which carry lower overhead than traditional office-based firms, have contributed to this shift by offering aggressive caps and near-100% plans as a recruiting tool.
Equity and stock-based incentives are also becoming more common outside of pure venture-backed brokerages, as more firms look for ways to retain top producers without simply cutting the brokerage's own margin further through split concessions. Expect more hybrid plans, too, structures that blend a modest cap with a smaller revenue-share layer, rather than the older either/or choice between a traditional split shop and a pure production-based model.
Automation is reshaping how these plans actually get administered day to day. Tiered splits, cap tracking, and fee reconciliation are increasingly handled through dedicated software rather than manual spreadsheets, which reduces payout errors and gives agents real-time visibility into exactly where they stand against a cap or tier threshold at any point in the year.
Comparison of Broker Compensation Models Across Different Regions or Markets
Compensation norms shift noticeably by market, mostly driven by average home prices and local cost of doing business. In high-price coastal markets, where a single transaction can generate GCI well above the national norm, capped models tend to dominate, because agents clear their annual cap in far fewer transactions and the uncapped upside afterward is worth substantially more in absolute dollars.
In lower-price, higher-volume markets, fixed splits without a cap often remain more common, since a modest cap threshold might only take a handful of deals to reach, making the administrative complexity of tracking it less worthwhile for either the agent or the brokerage. Rural and small-market brokerages also lean more heavily on straightforward fixed splits, partly because brokerage overhead and the support services funded by that split are simpler to begin with.
Regional brokerage culture plays a role too. Markets with a strong franchise-brand presence tend to see more franchise fee pass-throughs layered onto whatever base split or flat-fee structure is in place, while independent-heavy markets often negotiate more individualized, sometimes even individually customized, splits deal by deal. None of this means one region's "standard" split is right for your market. It means the same model can produce very different net outcomes depending on local price points and typical deal volume, which is exactly why the worksheet approach above matters more than copying whatever split a friend in a different city mentioned.
What Agents Get Wrong When They Switch Compensation Plans
Two mistakes come up constantly. First, agents chase a lower split percentage without checking whether the new brokerage still provides leads, training, or marketing support they were quietly relying on, then find themselves paying out of pocket for services that used to be bundled in. Second, agents accept a capped plan built around last year's production, then have a slow year and get stuck paying full freight toward a cap they never reach.
Three rules of thumb worth keeping in your back pocket: negotiate the cap dollar amount before you negotiate the split, since the cap usually moves the needle further. Ask for the last two years of average agent payout at that brokerage, not just the plan on paper. And never accept a verbal promise about fee waivers or bonus structures. Get it in the written agreement.
When you're interviewing a broker, ask directly: What's the average time to hit the cap for someone at my production level? What fees stack on top of the split? And how is payout timing handled when a transaction closes near month end?
— Theron
An Easier Way to Run the Numbers on Every Offer
There are other ways to track split math and cap thresholds, a personal spreadsheet, a broker's internal reporting portal, a back-of-napkin calculation after every closing. Each works until your pipeline gets busy enough that manual tracking starts costing you accuracy. A platform offers commercial real estate brokers a fee calculator, sample agreement templates, and a deal pipeline built specifically to keep split, cap, and fee math accurate deal by deal, without rebuilding a spreadsheet every time your production changes.
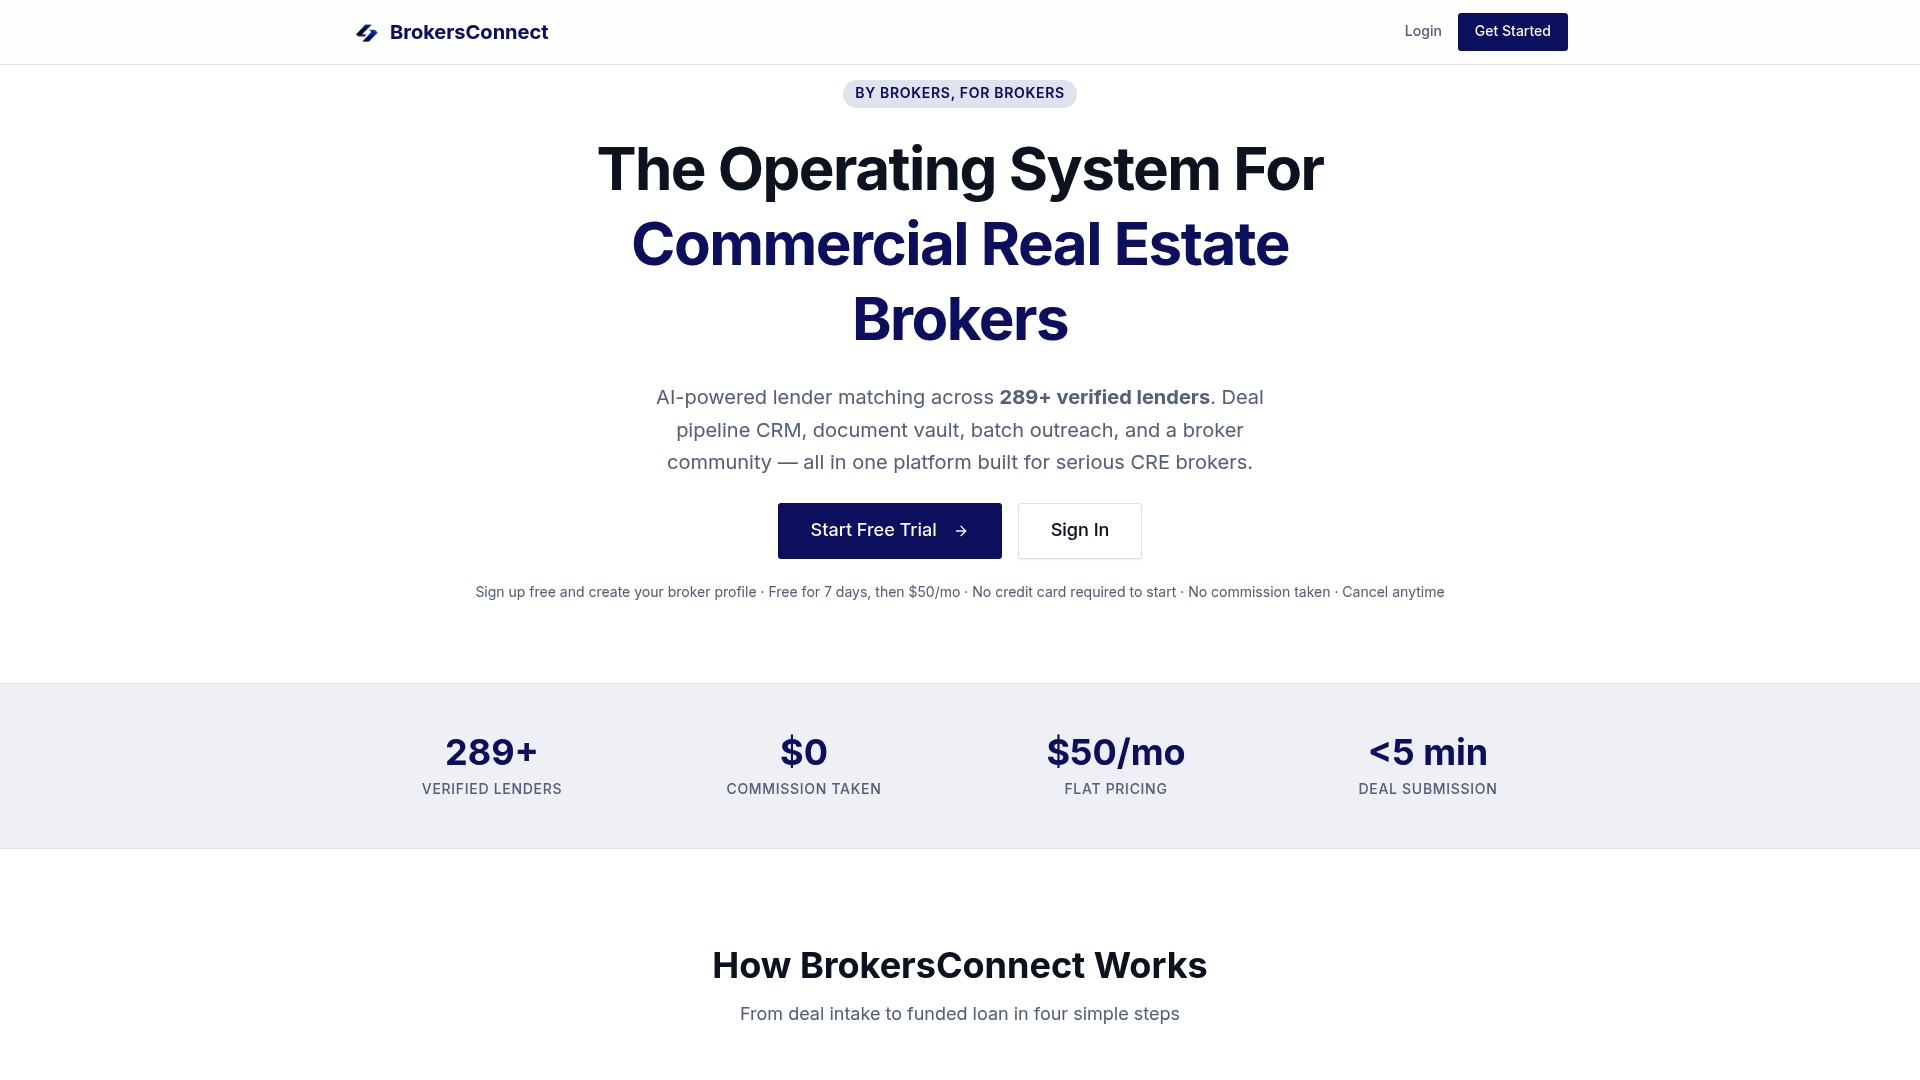
The platform isn't a brokerage and doesn't set your compensation plan for you. It's the operating layer that helps you implement whichever model you land on, whether that's tracking progress toward a cap, organizing lender and deal documentation in a secure vault, or comparing loan scenarios across 289 verified lenders while you manage the compensation side separately. If you've already run the worksheet above and picked your model, the next step is putting it into a system built to track it instead of a spreadsheet you'll outgrow by summer. Start a free trial on the BrokersConnect platform and see how the fee calculator and templates fit into your current deal flow.
Sources
- Understanding Agent Commission Plans
- Brokerage fee — Investopedia
- Guide to Broker Compensation in Real Estate Transactions
- Real Estate Commission Splits by Brokerage: Caps, Fees & Net Pay (2026)