
Pipeline velocity equals qualified opportunities times average deal size times win rate, divided by sales cycle length. The output tells you how many dollars your pipeline generates per day, not just how big it looks on a slide. Track it and you get an early warning system that flags exactly which lever is dragging on bookings, weeks before quota gets missed.
TL;DR:
- Segment pipeline velocity by product line, sales motion, lead source, and region to accurately identify underperforming areas or hidden bottlenecks.
- Comparing period-over-period changes in opportunity count, deal size, win rate, and cycle length allows precise diagnosis of the root cause when velocity drops.
- Shortening sales cycle length typically yields the fastest improvements, but it must be balanced with win rate stability to avoid losing deals.
- Using median cycle length rather than the average helps avoid skewed data caused by a few large, slow deals in highly variable deal sizes.
- Brokers and sales teams should monitor weekly shifts in each lever for early warning signs, enabling quick interventions before quarterly or yearly targets are missed.
Table of Contents
- What Is Pipeline Velocity and How Do You Calculate It?
- How Do You Calculate Pipeline Velocity? Three Worked Examples
- Why Does Segmentation Change What Velocity Tells You?
- How Do You Diagnose Which Lever Caused a Velocity Change?
- What Tactics Actually Move Each Velocity Lever?
- What Common Mistakes Make Velocity Data Unreliable?
- What Should a Pipeline Velocity Dashboard Include?
- What's a Good Pipeline Velocity Benchmark?
- How Does Pipeline Velocity Apply to Commercial Loan Broker Pipelines?
- Treat Velocity as an Early-Warning System, Not a Vanity Metric
- Measure and Accelerate Velocity with a Broker-Built Pipeline OS
- Sources
- FAQ
What Is Pipeline Velocity and How Do You Calculate It?
The formula has four moving parts, and each one needs a strict definition or the output becomes noise instead of signal.
- Number of qualified opportunities: count only deals that passed your actual qualification gate, not every meeting booked. If sales development reps and account executives disagree on what "qualified" means, your velocity number is measuring two different pipelines stitched together.
- Average deal size: decide upfront whether you're using annual contract value or total contract value, and never mix the two mid-quarter. ACV works better for subscription motions with renewals; TCV suits one-time or multi-year commercial deals.
- Win rate: closed-won divided by closed-won plus closed-lost, over the same window as the other three inputs. Excluding "no decision" deals from the denominator inflates win rate artificially.
- Sales cycle length: start the clock at the same qualification event every time, whether that's "opportunity created" or "first qualified call," and stop it at closed-won or closed-lost.
Get these four definitions locked before you calculate anything. A misaligned start date on cycle length alone can shift the entire output significantly.
How Do You Calculate Pipeline Velocity? Three Worked Examples
Here's how the math plays out across different motions and time windows.
- Mid-market SaaS, monthly: 40 qualified opportunities, $18,000 average deal size, 25% win rate, 45-day sales cycle. That's (40 × $18,000 × 0.25) ÷ 45 = $4,000 per day.
- Enterprise motion, quarterly: an example with fewer opportunities but larger deals and a longer cycle, resulting in a pipeline velocity of several thousand dollars per day, despite a lower deal count than mid-market.
- High-volume, short-cycle motion, daily: an example with many opportunities, smaller deal size, higher win rate, and short sales cycle yielding a higher pipeline velocity amount expressed in thousands of dollars per day.
To shift between windows, just adjust the cycle-length denominator: divide by 30 for a rough monthly rate, by 90 for quarterly, or by the actual number of days in your reporting period for precision. Some teams also run an "in-flight" version that measures pipeline value advancing at least one stage in a period, divided by days in that period. It's a useful companion metric because it tracks movement rather than final outcome, which catches stalls before they show up in win-rate data.
Why Does Segmentation Change What Velocity Tells You?
A single company-wide velocity number hides more than it reveals. Blending every product line, region, and motion into one figure can mask a segment that's quietly falling apart while a stronger one props up the average.
Segment velocity by these dimensions to see what's actually happening:
- Product line: a legacy product and a new launch rarely move at the same speed, and averaging them tells you nothing about either.
- Sales motion: self-serve, inside sales, and field sales have structurally different cycle lengths, so comparing them head-to-head is meaningless.
- Lead source: outbound-sourced deals often close slower than inbound or referral deals, which matters for budget allocation.
- Region: regulatory or seasonal patterns can stretch cycle length in ways that have nothing to do with sales execution.
Consistency matters as much as granularity. Qualification and win definitions have to stay identical across every segment, or you're comparing apples to a different fruit entirely. For cycle length specifically, use the median rather than the mean when your deal sizes vary widely. A handful of massive, slow-moving enterprise deals will drag a mean cycle length upward and mask what's actually happening with your typical deal.
How Do You Diagnose Which Lever Caused a Velocity Change?
When velocity drops, the instinct is to panic about "the pipeline." That's the wrong instinct. Comparing all four inputs period-over-period almost always isolates a single lever that moved, and figuring out which one changes what you do next entirely.
Build a simple driver tree: list this period's four inputs next to last period's, calculate the percentage change on each, and multiply that change against the metric's weight in the formula. The lever with the biggest weighted swing is your culprit.
- Opportunity count dropped: usually points to marketing or SDR pipeline generation, and ownership sits with demand generation and sales development.
- Average deal size shrank: often signals discounting creep or a shift toward smaller accounts, owned by sales leadership and pricing.
- Win rate fell: typically traces back to competitive losses or weak discovery, owned by enablement and frontline sales managers.
- Cycle length stretched: frequently a process or approval bottleneck, owned by RevOps and deal desk.
Pro Tip: Run this comparison every Monday, not just at quarter-end. A lever that's drifted for two weeks is a five-minute fix. A lever that's drifted for two months is a board conversation.
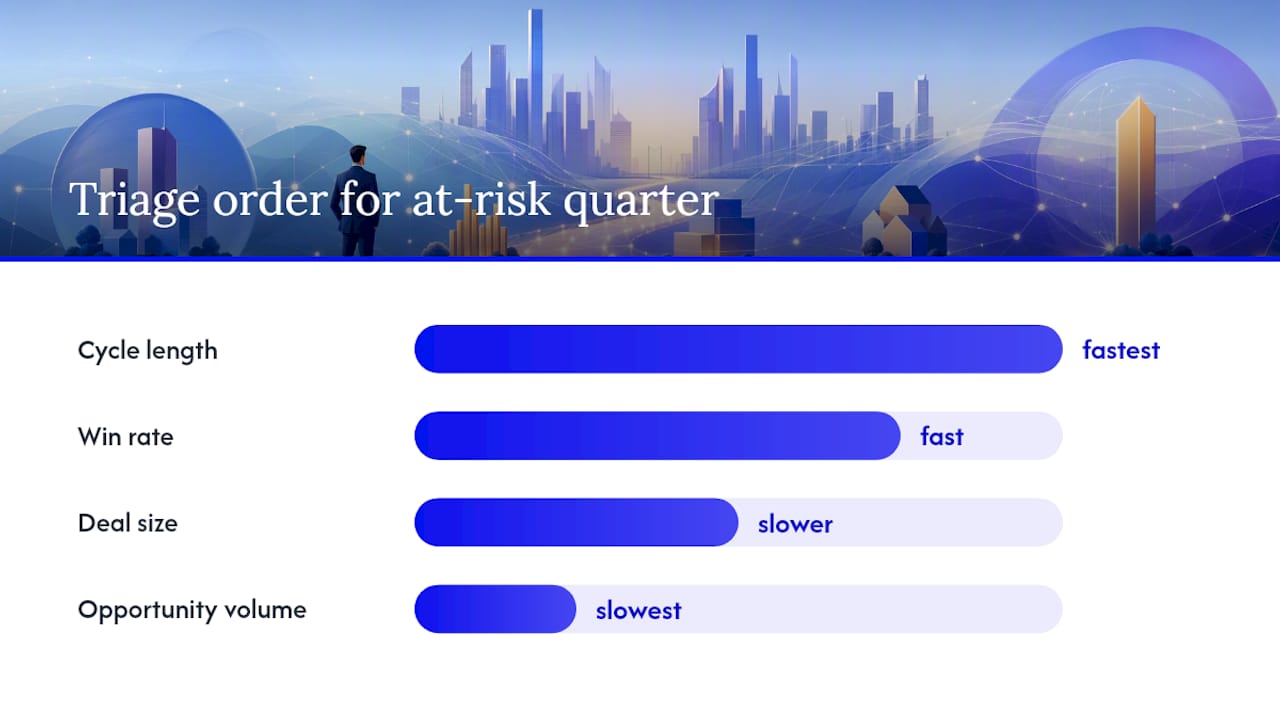
For an at-risk quarter, triage in this order: check cycle length first since it's usually the fastest to diagnose, then win rate, then deal size, then opportunity volume. This order reflects how quickly each lever typically responds to intervention.
What Tactics Actually Move Each Velocity Lever?
Improving pipeline velocity isn't one initiative. It's four separate playbooks running in parallel, and prioritizing correctly matters more than working all four at once.
- Grow opportunity volume: tighten your qualification criteria so SDRs pass fewer, better-fit leads rather than more low-quality ones. Pair outbound sequencing with intent data so reps prioritize accounts already showing buying signals, and audit your top-of-funnel marketing playbook quarterly.
- Lift average deal size: introduce tiered packaging that makes an upgrade path obvious during the sales conversation, not after signature. Segment pricing by company size or use case so reps aren't negotiating from a single anchor point, and train reps to lead with value-based questions before mentioning price.
- Improve win rate: build competitive battle cards for your three most common competitive losses and update them quarterly based on lost-deal interviews. Standardize a discovery framework so every rep asks the same disqualifying questions early, and run deal reviews on stalled opportunities before they hit day 60.
- Shorten sales cycle length: this is usually where the fastest gains hide. Pre-approve common contract terms so legal review isn't a two-week bottleneck. Build buyer-enablement content, like ROI calculators or implementation guides, that let champions sell internally without waiting on your next call. Redesign your approval workflow so deals under a certain size skip unnecessary sign-off layers.
Pro Tip: If you shorten cycle length aggressively, watch win rate for two full cycles afterward. Pushing buyers faster than they're ready to move can trade a speed gain for a win-rate loss, and the net effect on velocity can go either way.
What Common Mistakes Make Velocity Data Unreliable?
Three mistakes wreck velocity data more than any other, and all three are self-inflicted.
- Changing the qualification gate midstream: if marketing loosens or tightens the definition of "qualified" without notice, your opportunity count shifts for reasons that have nothing to do with pipeline health.
- Mixing cohorts across periods: comparing this quarter's enterprise-heavy pipeline against last quarter's SMB-heavy one produces a number that means nothing.
- Counting unqualified meetings as opportunities: this inflates volume and quietly tanks your win rate, since many of those "opportunities" were never going to close.
Run a data-hygiene check monthly: flag deals sitting in one stage for longer than your median cycle length, confirm activity recency on every open opportunity, and audit for automated stage moves that happened without a rep actually touching the deal.
What Should a Pipeline Velocity Dashboard Include?
Your CRM needs to capture four data types cleanly: opportunity qualification timestamps, closed-won and closed-lost history, stage-by-stage timestamps, and source attribution down to the campaign level. Without clean timestamps, cycle length calculations are guesses dressed up as data.
A useful dashboard includes:
- Trend line by segment: velocity plotted weekly or monthly, broken out by the segments that matter to your business.
- Lever-change callouts: automated flags when any single input moves more than a set threshold period-over-period.
- Coverage overlay: velocity next to pipeline coverage ratio, since coverage without velocity gives false confidence about whether pipeline will actually convert on time.
- Stalled-deal aging: a running list of opportunities exceeding your median cycle length, sorted by owner.
A centralized pipeline dashboard built around these widgets turns weekly pipeline review from a status update into an actual diagnostic session. Set a fixed cadence: weekly for RevOps, monthly for leadership, and immediate escalation any time a lever swings past your alert threshold.
What's a Good Pipeline Velocity Benchmark?
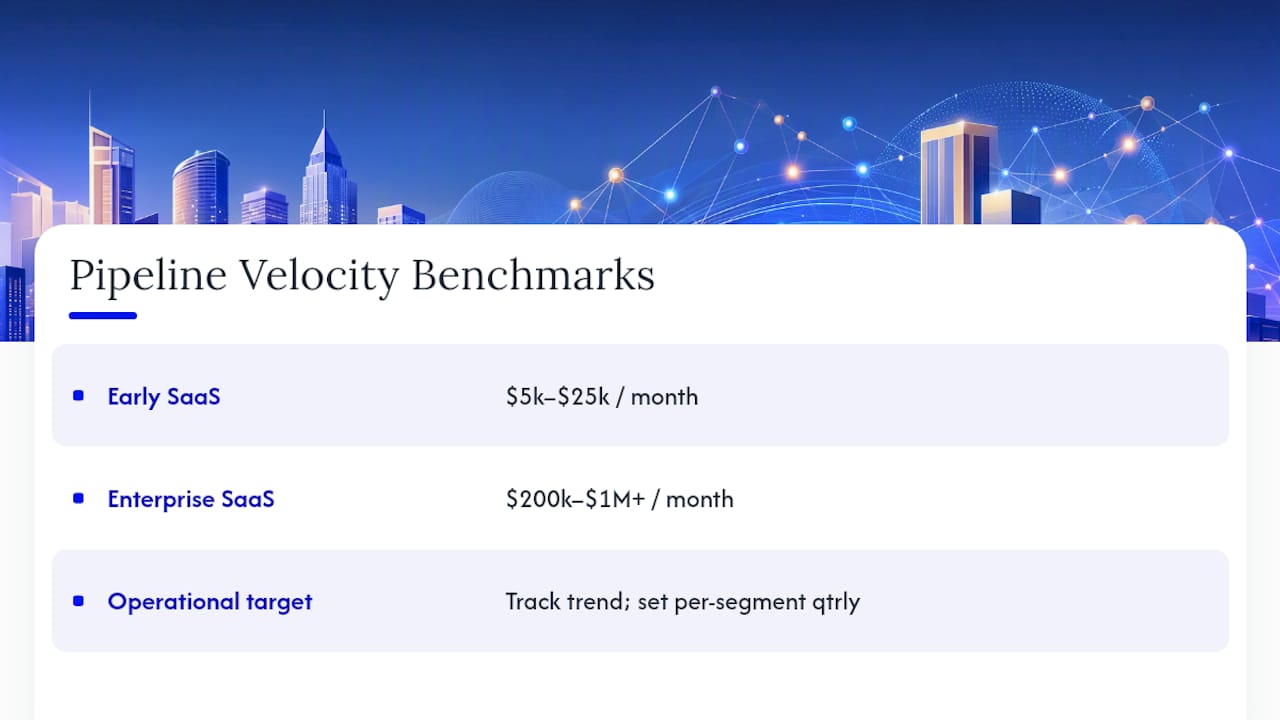
There isn't a single healthy number, and chasing one is a mistake. Directional ranges vary enormously by segment: early-stage SaaS motions often land around $5,000 to $25,000 per month, while enterprise SaaS motions can run from $200,000 to over $1 million per month, driven almost entirely by deal size rather than volume.
The number that matters more than any external benchmark is your own trend. A blended target hides which motion is actually improving and which is coasting on the other's momentum. Set targets per segment, per lever, and revisit them every quarter as your pipeline mix shifts.
How Does Pipeline Velocity Apply to Commercial Loan Broker Pipelines?
The formula translates directly to commercial real estate lending, with a few field-specific substitutions. A "qualified opportunity" becomes a scenario with verified property type, loan amount, and borrower credit profile ready for lender submission. Average deal size becomes loan amount or origination fee, and win rate becomes the percentage of submitted scenarios that reach funded close.
The lever that typically moves fastest in CRE brokerage is cycle length, and it moves fastest through better lender matching. Every day spent cold-calling lenders who don't fit a deal's property type or leverage profile is a day added to the sales cycle with zero chance of payoff.
- Faster lender identification cuts the "searching" phase that often eats the first two to three weeks of a deal timeline.
- A centralized deal pipeline view reduces time-in-stage by surfacing stalled submissions before they age past 30 days untouched.
- Standardized deal sizing and packaging, similar to what's covered in a DSCR loan workflow, shortens the prep phase before a scenario ever reaches a lender.
- Understanding financing thresholds, like the qualification criteria covered by BDC New England on high-leverage commercial financing, helps brokers pre-qualify scenarios before wasting a lender's time.
Treat Velocity as an Early-Warning System, Not a Vanity Metric
Most sales leaders check pipeline health when a forecast miss already happened. That's backwards. Velocity earns its keep specifically because it flags a lever slipping two or three weeks before the miss shows up in a quota number, and leaders who only glance at it during quarterly business reviews are throwing away that lead time.
A simple weekly checklist works better than any dashboard on its own: RevOps pulls the four-input comparison every Monday, the sales manager owns any win-rate or cycle-length drift, and marketing owns any opportunity-volume drift. Assign the lever, not the symptom. In commercial real estate lending specifically, cycle-length drift is almost always a lender-matching problem in disguise, and treating it as anything else wastes a quarter chasing the wrong fix.
— Theron
Measure and Accelerate Velocity with a Broker-Built Pipeline OS
Generic CRM tools weren't built for commercial real estate financing, which means brokers end up bolting spreadsheets onto software that doesn't understand loan stages, lender fit, or submission tracking. Thecrebrokersconnect closes that gap with a pipeline system built specifically around how CRE deals actually move from scenario to funded close.
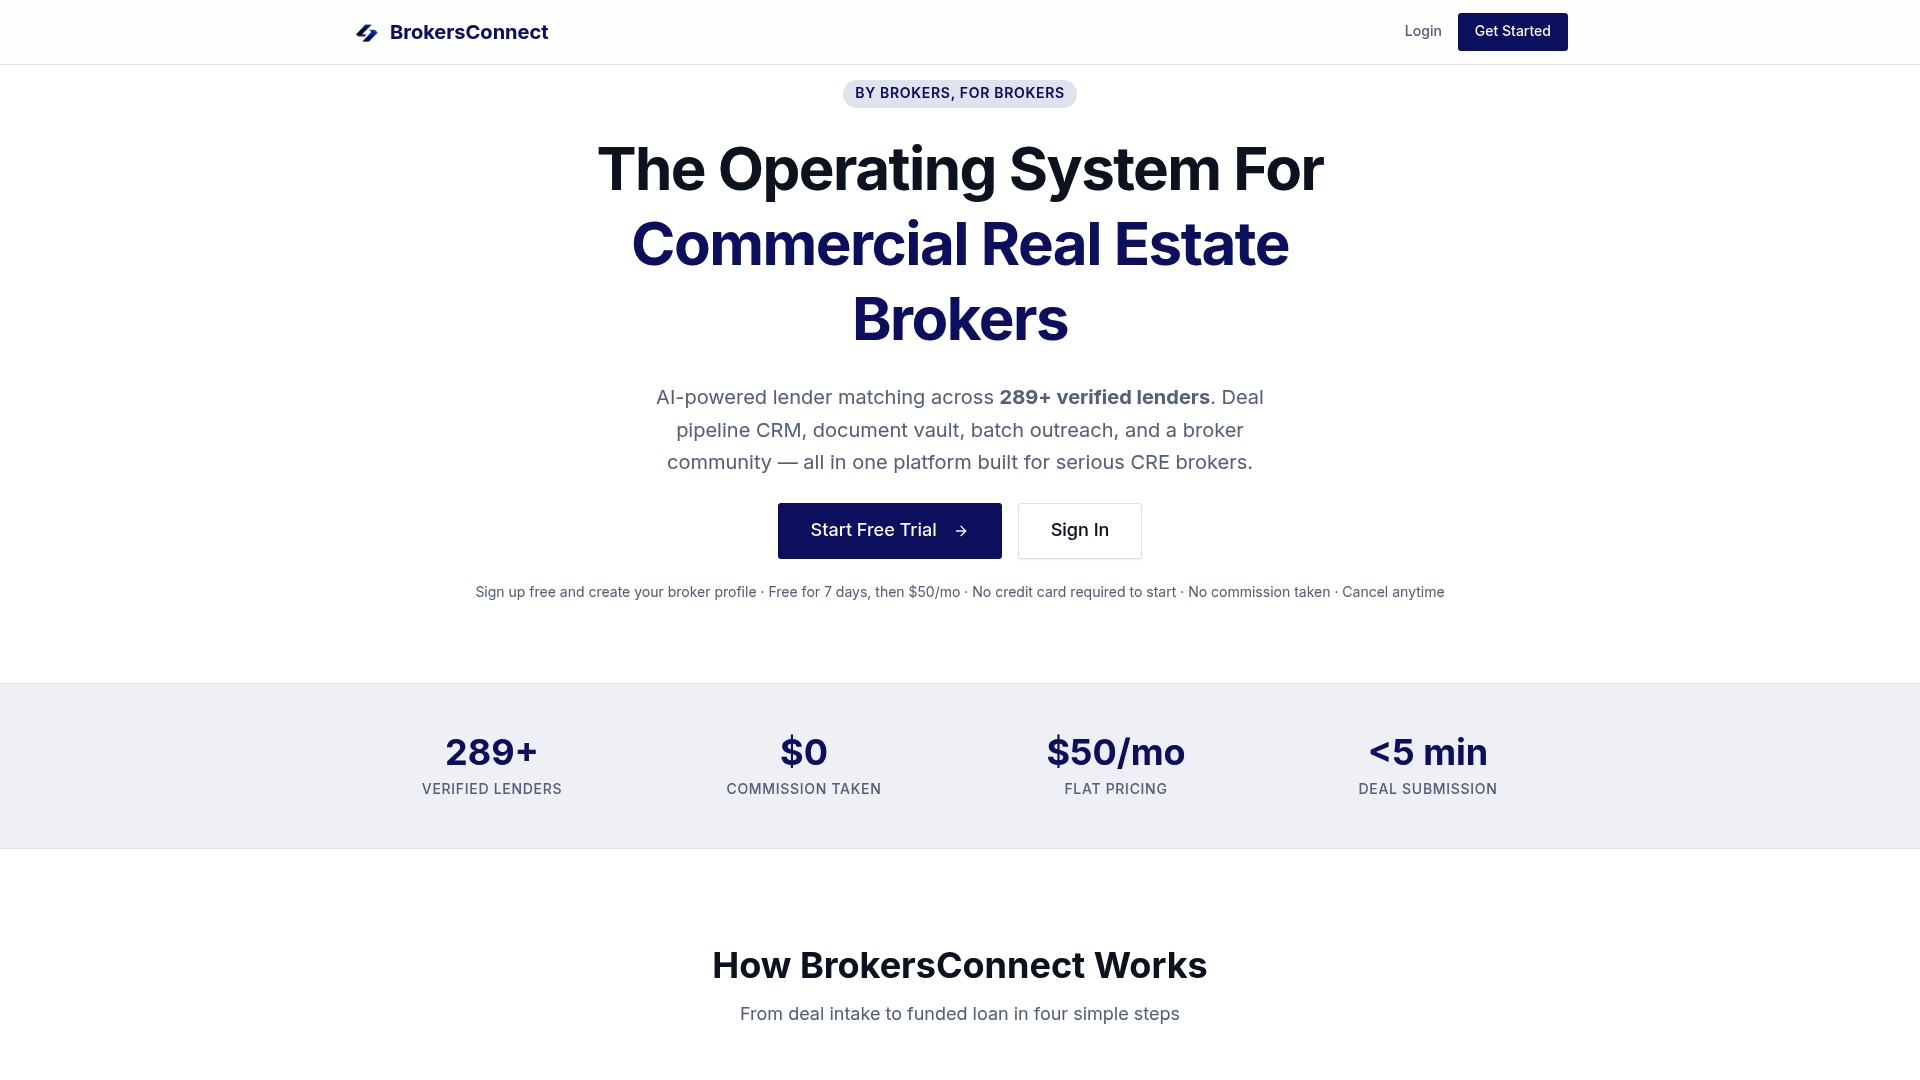
The platform gives brokers a deal pipeline CRM built around loan stages instead of generic sales stages, AI-powered lender matching against a large verified lender database, and batch outreach tools that cut the cold-calling phase down to hours instead of weeks. Every one of those features maps directly to a velocity lever: lender matching shrinks cycle length, the pipeline dashboard surfaces stalled deals before they age out, and deal templates speed up how fast a scenario gets submission-ready.
BrokersConnect offers flat monthly pricing with a free trial and no commission on funded deals. If you're tracking your own pipeline velocity right now and don't like what the cycle-length number is telling you, start a trial and see where lender matching alone moves the needle.
Sources
- Pipeline velocity: How to measure and improve it — Outreach
- Pipeline Metrics: Coverage, Velocity & KPIs | Artemis GTM
- Pipeline Velocity: Formula, Benchmarks & Tips | Count
- Pipeline Velocity Formula and Levers | Tenbound
FAQ
How Is Pipeline Velocity Calculated?
Multiply the number of qualified opportunities by average deal size and win rate, then divide by average sales cycle length in days. The result is revenue generated per day.
What Is a Good Sales Velocity Number?
There's no universal number since it depends entirely on deal size and motion. Early-stage SaaS often runs $5,000 to $25,000 per month, while enterprise motions can exceed $200,000 to $1 million per month, so track your own quarter-over-quarter trend instead of an external benchmark.
How Do I Know Which Lever Caused My Velocity to Drop?
Compare all four inputs, opportunity count, deal size, win rate, and cycle length, against the prior period and calculate the percentage change on each. The input with the largest weighted swing is usually the root cause.
Can BrokersConnect Help Me Track Pipeline Velocity for Loan Deals?
Yes. BrokersConnect's pipeline CRM tracks deal stages, timestamps, and lender responses so brokers can see where scenarios stall and calculate cycle length accurately.
Should I Use Median or Mean for Sales Cycle Length?
Use the median when deal sizes vary widely, since a few unusually slow, large deals can skew the mean upward and misrepresent your typical cycle time.