
Track six numbers this week: stage win rate, submission-to-fund conversion, average days-in-stage, application-start-to-submission rate, lender response rate, and pipeline velocity. Then do one thing with them: run a single scoring pass on your current top 10 deals, ranking each by pull-through probability times expected fee times urgency, and act on what falls out. BrokersConnect's pipeline tools are built around exactly this workflow, but the math works in a spreadsheet too.
TL;DR:
- Monitoring submission-to-fund conversion and lender response times helps identify underperforming lenders and adjust lender relationships accordingly.
- Tracking days-in-stage reveals bottlenecks in the process, such as delays in documentation or borrower follow-up, enabling targeted action.
- Applying scoring based on pull-through probability, value, and urgency prioritizes the most promising deals for immediate attention.
- Replacing optimistic close dates with concrete workstream checkpoints improves forecasting accuracy and creates an effective audit trail.
- Using a real-time pipeline dashboard with automated updates reduces data staleness, improves discipline, and enhances decision-making accuracy.
Table of Contents
- What Each Commercial Loan Pipeline Metric Actually Tells You
- How to Calculate Loan Pipeline Metrics: Formulas and a Worked Example
- Scoring and Triage: Where to Spend Your Time Today
- Building a Pipeline Dashboard That Doesn't Go Stale
- Forecasting Revenue Off a Pipeline That Tells the Truth
- Connecting Pipeline Metrics to Your CRM and Loan Origination Tools
- What Pipeline Metrics Reveal About Risk and Compliance
- Real Improvements From Tracking the Right Numbers
- Theron's Practical Take: The Three Mistakes That Cost Brokers the Most
- Put These Metrics to Work With BrokersConnect
- Sources
- FAQ
What Each Commercial Loan Pipeline Metric Actually Tells You
Most brokerage pipelines run on stage labels borrowed from generic CRM templates, which is part of why they lie to you. "In underwriting" means nothing if it can't tell you whether a lender is waiting on a rent roll or has already gone quiet for nine days. The fix is workstream status fields (document received, quote outstanding, term sheet issued) instead of a single soft stage name plus an optimistic expected close date that nobody updates. MotionCRE recommends logging every sourced deal along with the reason it dies, because that's the only way conversion numbers mean anything six months from now.
Here's what the core metrics measure and why each one changes your next move:
- Stage win rate (pull-through): the share of deals entering a given stage that eventually fund. Low pull-through in "submitted to lender" tells you the deals you're sending are mismatched to the lenders you're sending them to.
- Submission-to-fund conversion: funded loans divided by lender submissions. This is your real close rate once a deal leaves your desk, and it's the number that should drive which lenders stay on your short list.
- Average days-in-stage: how long a deal sits in each phase before moving. A rent roll waiting three weeks in "documents requested" is a dead giveaway that the borrower needs a call, not another email.
- Application-start-to-submission rate: the percentage of borrowers who start an application and actually complete it. This one gets ignored constantly, and it shouldn't.
- Lender response rate: how often, and how fast, a lender replies with a real answer instead of silence.
- Pipeline velocity: how fast dollar volume moves through the whole funnel, combining deal count, average size, win rate, and cycle time into one throughput number.
Each metric answers a different operational question. Win rate tells you which lenders to keep testing. Days-in-stage tells you who to call today. Application completion tells you where borrowers are quietly walking away before a lender ever sees the file.
How to Calculate Loan Pipeline Metrics: Formulas and a Worked Example
You need eight fields per deal to make any of this work: deal ID, current stage, date entered stage, submission date, funded date (if applicable), assigned lender, loan amount, and deal owner. Everything downstream builds from those.
The formulas themselves are simply arithmetic, not statistics:
- Stage win rate = funded deals originating from a stage ÷ total deals that entered that stage
- Submission-to-fund % = funded loans ÷ total lender submissions
- Average days-in-stage = sum of days each deal spent in a stage ÷ number of deals that passed through it
- Application-start-to-submission % = completed submissions ÷ application starts
- Pipeline velocity = (number of open opportunities × average deal value × win rate) ÷ average cycle length in days
That last formula is worth sitting with. It rewards speed as much as volume. Two brokers with identical pipelines in dollar terms can have wildly different velocity if one closes in 35 days and the other in 65.
The application completion metric deserves special attention because the payoff compounds. MBA's own analysis lays out the math: improving application-start-to-submission rate from 70% to 80% across 10,000 application starts produces roughly 137 additional funded loans and about $1.23 million in incremental revenue, using the industry's own example figures.
A 10-point completion gain, scaled down: On a broker's book of 200 application starts a year, the same 10-point lift in completion (70% to 80%) adds roughly 2 to 3 more funded deals annually with zero extra marketing spend, purely from borrowers who otherwise would have dropped off mid-application.
That's not a lead-generation problem. It's a process problem, and it's fixable with reminders, faster document requests, and someone whose job is literally to chase incomplete applications.
Scoring and Triage: Where to Spend Your Time Today
A pipeline with 40 open deals doesn't need 40 equal check-ins. It needs a scoring system that tells you which five deserve a phone call this morning.
Use a simple deal score: probability (historical stage pull-through) × expected funded value × urgency modifier (days already spent in current stage). A $2 million deal sitting at 60% historical pull-through for its stage, but stalled for 18 days against a typical 7-day turn, should outrank a fresh $5 million deal that just entered the pipeline yesterday. Urgency without value is noise, but value without urgency lets deals rot.
From that score, apply three triage rules:
- Escalate high-score, stalled deals immediately. These are your best dollars sitting idle for a reason worth investigating today.
- Re-market low-probability, high-value deals to a different lender before they die quietly on one desk.
- Pause or deprioritize low-score, low-value opportunities rather than spreading attention evenly across everything open.
Lender responsiveness feeds directly into this scoring, and it's measurable in the same two fields every time: time-to-first-response and quote completeness (does the first reply include real terms or just an acknowledgment). Lenders with sub-31-day turn times consistently outperform the field, since top 20th percentile lenders in the broker wholesale channel averaged 30.6 days or less against a broader average of 33.8 days. Track that gap by lender and let it decide who gets your next deal, and who gets replaced.
Pro Tip: Kill the "expected close date" field entirely. Replace it with concrete workstream checkpoints, like "rent roll received" or "lender quote outstanding," because those are facts, not guesses, and they force honest updates instead of wishful ones.

Building a Pipeline Dashboard That Doesn't Go Stale
A dashboard only earns its keep if someone looks at it daily and the numbers on it are true. Six widgets cover most of what a brokerage needs: live deals by stage, a days-in-stage heat map that flags anything sitting too long, a top-10 stalled-deals list, expected funded pipeline value, a lender-response leaderboard, and recent pull-through rate by loan program.

Cadence matters as much as the widgets themselves. A daily operational board works for closers actively moving deals forward. A weekly pipeline review, with the whole team or brokerage owner present, catches the deals that fell through the cracks during the week. A monthly performance review compares actual pull-through and cycle times against benchmarks like the MBA's turn-time data, so drift gets caught before it becomes a pattern.
Ownership is the piece brokerages skip most often. The rule is simple: whoever is doing the work on a deal updates its status, not an assistant reading through old emails once a week. Real-time updates matter because a stale dashboard is worse than no dashboard. It creates false confidence, and false confidence is exactly what lets a $3 million deal sit forgotten for three weeks. Templates for this kind of live tracking are laid out in more detail in BrokersConnect's loan pipeline dashboard guide.
Forecasting Revenue Off a Pipeline That Tells the Truth
Revenue forecasting is only as good as the pull-through assumptions feeding it, and most brokers guess at those assumptions instead of measuring them. If you know your historical stage win rate by loan program, bridge deals convert differently than multifamily agency deals, for instance, you can weight your open pipeline by realistic probability instead of treating every open deal as equally likely to close.
This is exactly the logic that hedge desks use at a much larger scale. MCT's whitepaper on pipeline hedging explains how lenders track pull-through by bucket, using betas and theta to model how new locks, committed production, and expected fallout move required hedge coverage. A broker doesn't need to hedge anything, but the underlying idea transfers directly: segment your pipeline by program and measure pull-through separately for each one, rather than relying on a single blended average that hides which loan types are actually reliable.
Once you have real pull-through by segment, a revenue forecast becomes a weighted sum instead of a guess: open pipeline value, multiplied by segment-specific pull-through, divided by average cycle time, gives you a defensible monthly or quarterly funded-volume projection. That number holds up in a conversation with a brokerage owner or a lender partner in a way that "it feels like a good quarter" never will.
Connecting Pipeline Metrics to Your CRM and Loan Origination Tools
Metrics only stay accurate if they update where the work actually happens, which means the CRM or loan origination system needs to be the single source of truth, not a side spreadsheet someone updates on Fridays. Every field that feeds a formula, stage, dates, lender assignment, loan amount, needs to live in the same system a broker touches daily, or the numbers drift within weeks.
The integration problem shows up most often between deal pipeline tools and lender communication. If lender responses land in email and stage updates live in a CRM, someone has to manually bridge the two, and that manual step is where data goes stale. Platforms built specifically for commercial mortgage brokers close that gap by pairing lender outreach and pipeline status in one place, so a lender's quote automatically updates the deal's workstream status instead of waiting for someone to notice the email.
The practical standard: pick one system as the pipeline of record, define the eight core fields once, mentioned earlier: deal ID, stage, dates, lender, amount, owner, and enforce that every status change gets logged there in real time, not batched. BrokersConnect's deal pipeline management guide walks through stage vocabulary and field templates that map cleanly onto most CRM setups, which matters more than which specific software you use.
What Pipeline Metrics Reveal About Risk and Compliance
Pipeline metrics aren't just a productivity tool. They're an early warning system for risk exposure a broker might not otherwise see. A sudden drop in submission-to-fund conversion for one lender can signal that the lender's credit box has tightened quietly, before anyone tells you directly. Tracking that shift by lender protects your borrowers from being sent into a program that's about to reject them.
Deal age distribution matters here too. A pipeline where deals cluster at the extremes, either fresh or badly stalled, with nothing moving steadily through the middle, often points to a process breakdown that eventually becomes a compliance headache: missed disclosure timelines, stale financials submitted to a lender, or a borrower's rate lock expiring because nobody was watching days-in-stage closely enough.
Documented workstream statuses also create an audit trail that protects the brokerage. If a regulator or lender ever asks why a deal took 90 days instead of 35, "rent roll requested on day 3, received on day 22, resubmitted on day 24" is a defensible answer. "It was in underwriting" is not. This is another reason to abandon optimistic expected-close-date fields in favor of concrete, timestamped checkpoints, the same fix that improves forecasting also improves your paper trail.
Real Improvements From Tracking the Right Numbers
The clearest pattern in brokerages that fix their pipeline metrics is that the wins show up first in the deals that were already good, not in finding new business. A broker who starts tracking days-in-stage typically finds three or four deals immediately that have been quietly stalled for two weeks longer than anyone realized, simply because nobody had a heat map flagging it.
The application-completion metric tends to produce the fastest measurable lift. Brokers who start following up systematically on incomplete applications, rather than waiting for borrowers to finish on their own timeline, routinely close the gap between application starts and submissions within a single quarter. Given the MBA's modeling on completion rates, even a modest improvement compounds into several extra funded loans a year without adding a single new lead.
Lender scoring produces a slower but more durable improvement. Once a broker has three or four months of response-time and pull-through data by lender, decisions about where to send a marginal deal stop being based on relationship history alone and start being based on which lender actually closes that loan type fastest. That shift, more than any single metric, is what separates a pipeline that runs on gut feel from one that runs on evidence.
Theron's Practical Take: The Three Mistakes That Cost Brokers the Most
The brokers who struggle with pipeline management almost never lack data. They lack discipline about three specific things. First, optimistic date fields: "expected close" fields get updated to feel good, not to reflect reality, and they quietly poison every forecast built on top of them. Swap them for workstream checkpoints today.
Second, no lender tracking. Brokers who don't log response time and quote quality by lender end up sending deals out of habit rather than performance, and they never notice when a once reliable lender slows down.
Third, no triage rules. Without a scoring system, every deal gets equal attention, which means none of them get enough. Start with the scoring formula covered earlier this week, not next quarter. For a deeper implementation walkthrough, the loan pipeline dashboard guide is worth a read.
— Theron
Put These Metrics to Work With BrokersConnect
Reading about stage win rates and lender response times is one thing. Watching them update in real time, without you manually pulling numbers from six different email threads, is another. BrokersConnect gives brokers a live pipeline dashboard with workstream statuses instead of guessy close dates, a lender-responsiveness leaderboard that tracks who actually replies fast with real terms, and AI lender matching pulled from a database of verified lenders across major CRE asset classes.
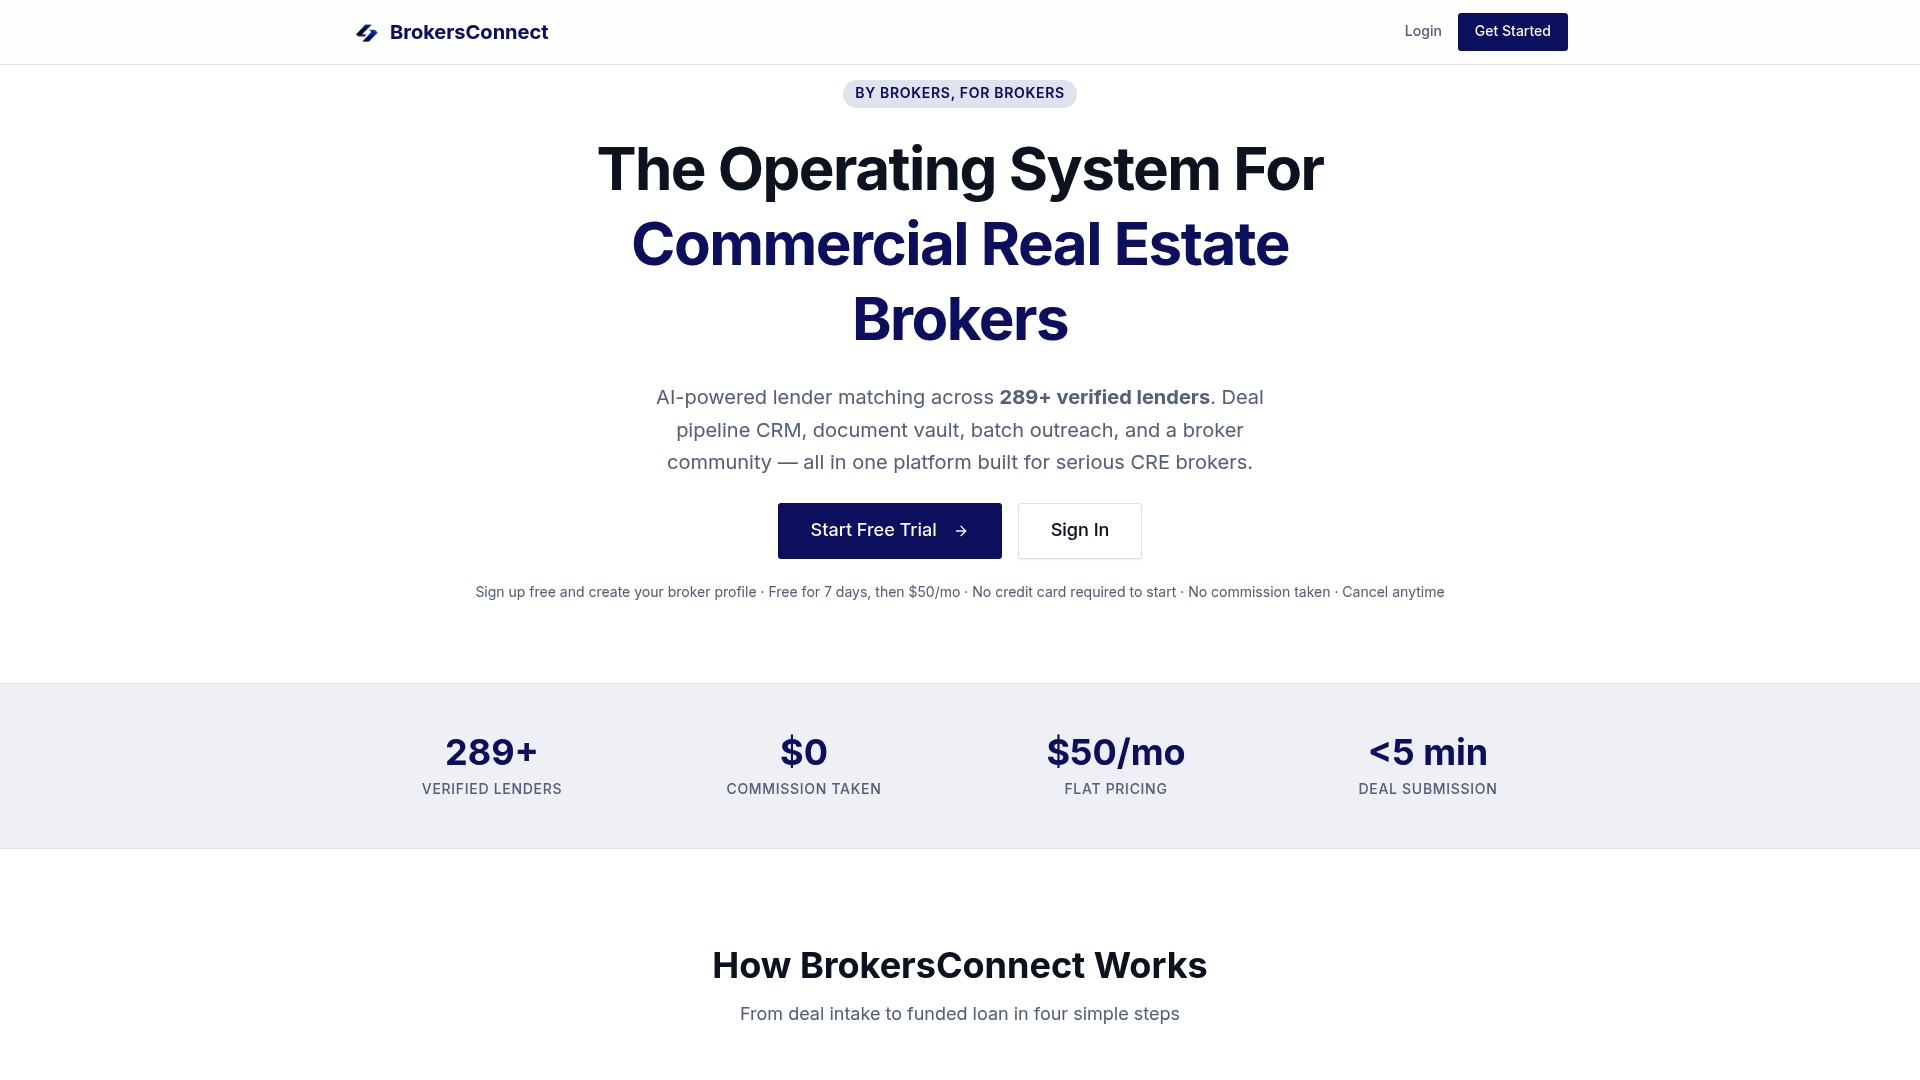
Every triage rule and scoring formula in this guide runs cleaner when the underlying data updates itself instead of living in a spreadsheet someone forgets to touch. BrokersConnect costs $50 per month, flat, with no commission fees, and a free trial to test it against your current pipeline before committing. Start the trial, load your top 10 open deals, and see which ones the scoring math tells you to call first.
Sources
- MBA editorial: Application abandonment — the silent killer of mortgage profits (Sept 2025)
- MotionCRE: What is deal flow management in commercial real estate?
FAQ
How Often Should I Update Commercial Loan Pipeline Metrics?
Deal-level statuses should update in real time, whenever a workstream checkpoint changes, not on a weekly batch schedule. Dashboard review cadence should run daily for active closers and weekly for a full pipeline review with the team.
What Is the Single Most Important Pipeline Metric to Track?
Application-start-to-submission rate tends to deliver the fastest measurable payoff, since MBA's own modeling shows a 10-point completion improvement on 10,000 starts adding roughly 137 funded loans. For an individual broker's book, that scales down but still compounds meaningfully within a quarter.
What Turn Time Should I Expect From a Good Lender?
Top-performing lenders in the broker wholesale channel averaged 30.6 days or less in Q1 2025, against a broader average of 33.8 days. Anything consistently slower than that average is worth flagging on your lender scorecard.
How Do I Track Lender Responsiveness Without Extra Software?
At minimum, log time-to-first-response and whether that first reply included complete quote terms or just an acknowledgment, for every submission. Platforms like BrokersConnect automate this into a lender-responsiveness leaderboard so the pattern shows up without manual spreadsheet work.
Can I Use These Metrics if I Only Track a Handful of Deals?
Yes. Stage win rate and days-in-stage still work with a small pipeline; the formulas don't require volume to be meaningful. What matters more at small scale is consistency: use the same stage definitions and fields every time so the numbers stay comparable month to month.